
COGNITIVE
SYSTEMs
*Now known as Power systems

Hardware Management Console
I was the lead researcher and co-lead UX designer on IBM's Hardware Management Console project and our team was responsible for designing, researching and user testing with our clients. I also in charge of handling the sponsor user program and maintaining client relationships.
HARDWARE MANAGEMENT CONSOLE (HMC)
Hardware Management Console (HMC) is a specialized device used for managing and controlling IBM Power Systems servers. It is a hardware component that provides a dedicated interface and tools for system administrators to monitor, configure, and control the hardware and software resources of Power System servers.
.jpg)
Power servers
PERSONAS
HMC GUI was released almost 50+ years back and our goal was to build trust with our users so that we understand their requirements and convert the legacy GUI to IBM design language while improving the user experience.


user interface
Here are a few examples of the new and legacy screens of the application.


Feature deep dive.
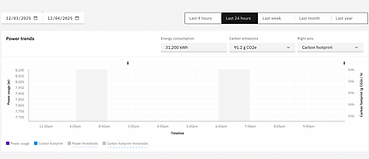
ENvironmental dashboard
One of the most anticipated features of the product was the environmental dashboard. As a completely new capability, it attracted multiple RFEs, highlighting strong user interest and unmet needs.
Why we chose to act on this RFE?
Organizations are increasingly being held accountable for their energy consumption. This made it critical for them to understand how their servers are performing from an environmental perspective, as well as to report these metrics accurately to leadership and stakeholders.
DISCOVERY RESEARCH


Workshop facilitation for discovery research
We conducted workshops with the SME's and few users to understand the process, requiremnets and problems and then followed up with surveys and interviews to gain a wider perspective on the feature.
14
User interviews
4
SME sessions
44
Surveys
Design team challenges / questions
-
Multiple users requesting different sub features - how do we prioritise?
-
Enormous amount of data to be shown - how do we make it scanable?
-
Delays in receiving accurate data
-
Can we provide insights/recommendations to customers about when they can save money by switching to a lower energy mode?
-
Can we automate lower-energy mode based on historical data?


Affinity mapping
Using qualtrics and IBM AI (ICA) we synthesized the data and conducted a prioritisation workshop with the SME's to finalise on the data.
Priority map
Insights
-
Alerts to be sent when the energy exceeds minimum or maximum threshold limits.
-
Graphs with trends and data points in metrics that can be consumed easily
-
Date range available only for data received
-
Quick switch between systems to understand patterns
-
General trend and usage should be shown first
-
Low energy mode should only be manually opted - as this could disrupt operations
-
Different companies are being billed differently so providing insights on $ saved is a huge effort and probably a future enhancement.
Iterations


Testing
We validated the mockups with users to ensure the experience was clear and that no critical information was missing. After incorporating feedback and making final refinements, the environmental dashboard was released in 2025 following five months of research and design and four months of development.


Threshold reached zoom in

Editing threshold
Final dashboard
Editing threshold options
Validation
While we are not permitted to track user activity within the application, we reached out to our database to gather feedback on the feature. Most respondents requested additional capabilities, which validated our initial decision to introduce this feature. We also observed an increase in RFEs related to it, further reinforcing that users find value in the feature. Based on this feedback, the next round of design is currently underway to enhance and evolve the experience.